
⚡ Performance and Efficiency Benchmarks
This section reports the performance of Qwen 3.5 on NPU with FastFlowLM (FLM).
Note:
- Results are based on FastFlowLM v0.9.38.
- Under FLM’s default NPU power mode (Performance)
- Newer versions may deliver improved performance.
- Fine-tuned models show performance comparable to their base models.
Test System 1:
AMD Ryzen™ AI 7 350 (Kraken Point) with 32 GB DRAM; performance is comparable to other Kraken Point systems.
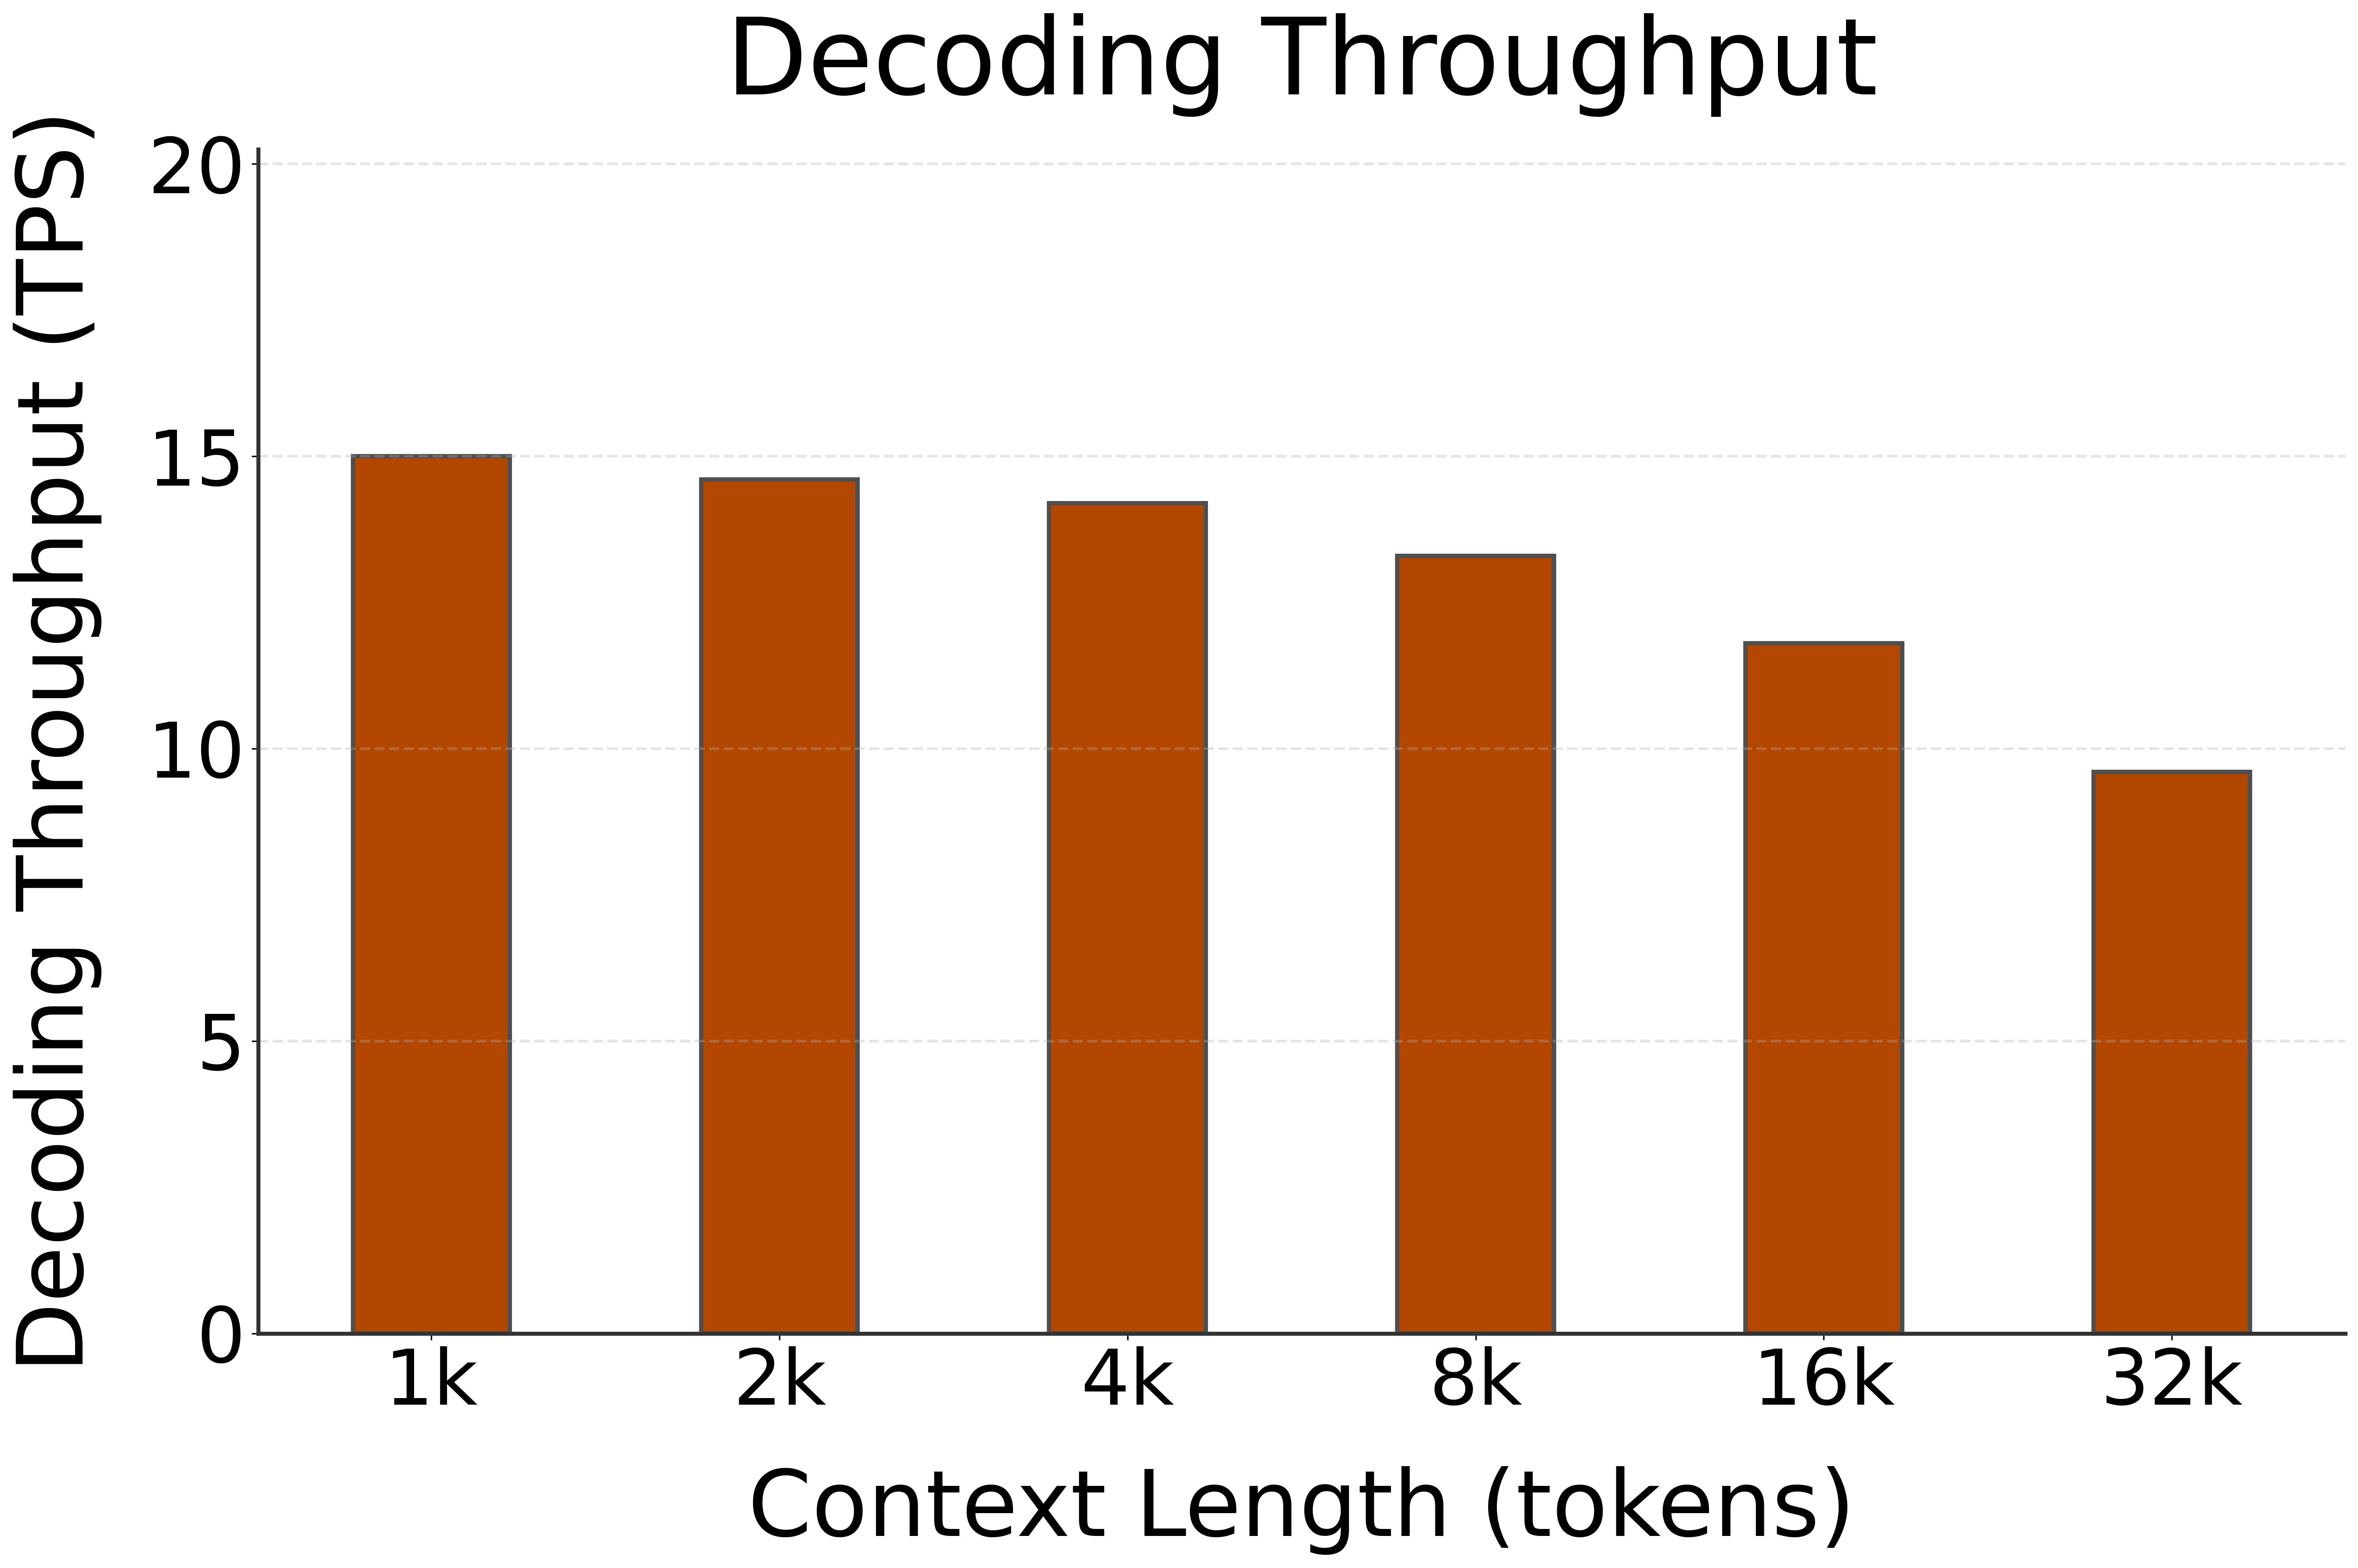
🚀 Decoding Speed (TPS, or Tokens per Second, starting @ different context lengths)
| Model | HW | 1k | 2k | 4k | 8k | 16k | 32k |
|---|---|---|---|---|---|---|---|
| Qwen3.5-0.8B | NPU (FLM) | 44.83 | 43.84 | 40.3 | 36.5 | 30.21 | 22.8 |
| Qwen3.5-2B | NPU (FLM) | 28.92 | 28.33 | 27.18 | 25.34 | 22.3 | 17.98 |
| Qwen3.5-4B | NPU (FLM) | 15.9 | 15.6 | 15.02 | 14.03 | 12.35 | 9.98 |
| Qwen3.5-9B | NPU (FLM) | 9.9 | 9.8 | 9.56 | 9.15 | 8.41 | 7.24 |
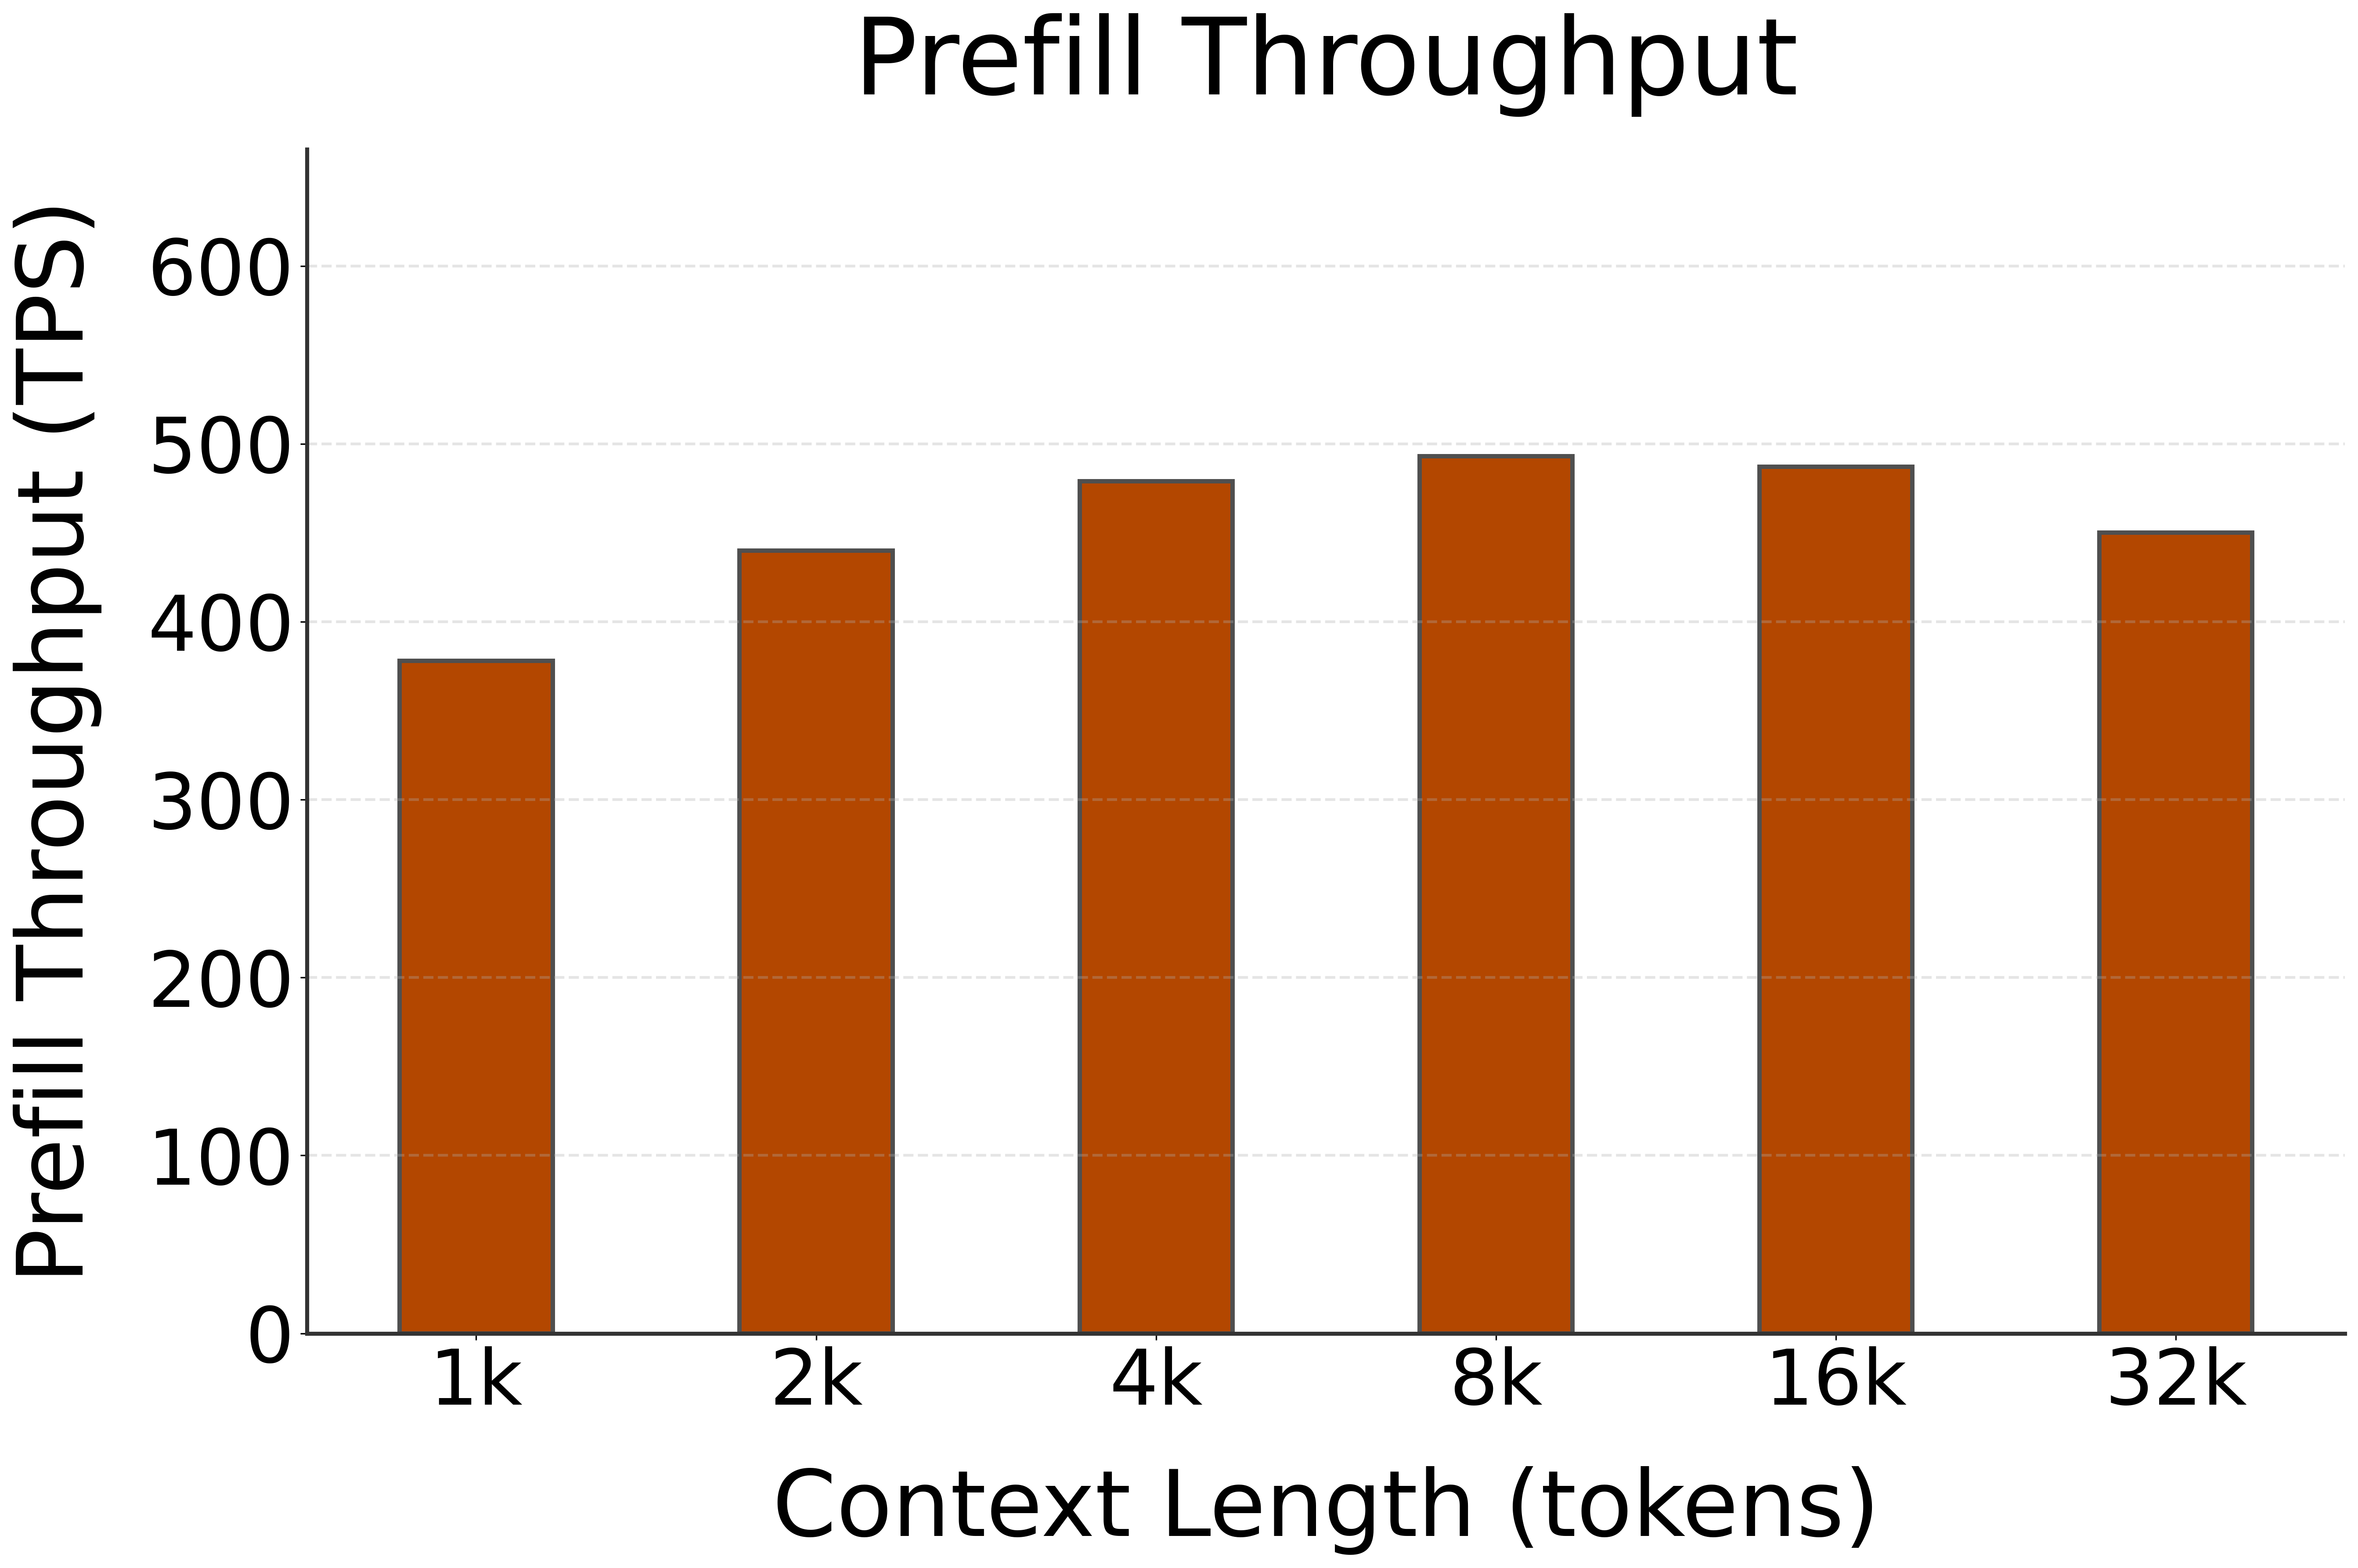
🚀 Prefill Speed (TPS, or Tokens per Second, with different prompt lengths)
| Model | HW | 1k | 2k | 4k | 8k | 16k | 32k |
|---|---|---|---|---|---|---|---|
| Qwen3.5-0.8B | NPU (FLM) | 851.21 | 1285.09 | 1744.47 | 2007.97 | 2084.64 | 1912.63 |
| Qwen3.5-2B | NPU (FLM) | 625.99 | 929.93 | 1198.04 | 1367.84 | 1443.05 | 1381.91 |
| Qwen3.5-4B | NPU (FLM) | 322.37 | 445.63 | 543.15 | 599.95 | 616.35 | 571.6 |
| Qwen3.5-9B | NPU (FLM) | 248.76 | 328.1 | 391.6 | 420.5 | 436.25 | 416.65 |
🚀 Prefill TTFT with Image Input (Seconds)
Prefill time-to-first-token (TTFT) for Qwen3.5-4B on NPU (FastFlowLM) with different image resolutions.
Mid Resolution Images:
| Model | HW | 720p (1280×720) | 1080p (1920×1080) |
|---|---|---|---|
| Qwen3.5-0.8B | NPU (FLM) | 1.3 | 2.6 |
| Qwen3.5-2B | NPU (FLM) | 2.1 | 4.6 |
| Qwen3.5-4B | NPU (FLM) | 3.4 | 6.8 |
| Qwen3.5-9B | NPU (FLM) | 4.4 | 9.4 |
High Resolution Images:
| Model | HW | 2K (2560×1440) | 4K (3840×2160) |
|---|---|---|---|
| Qwen3.5-0.8B | NPU (FLM) | 5.0 | 13.3 |
| Qwen3.5-2B | NPU (FLM) | 9.1 | 29.1 |
| Qwen3.5-4B | NPU (FLM) | 12.6 | 36.1 |
| Qwen3.5-9B | NPU (FLM) | 16.2 | 47.3 |
This test uses a short prompt: “Describe this image.”